





The platform

Forecasting that fits the way planning teams work.

Bring operational data into one focused workspace, test the forecast on evidence, and carry a clear result back into the planning conversation.

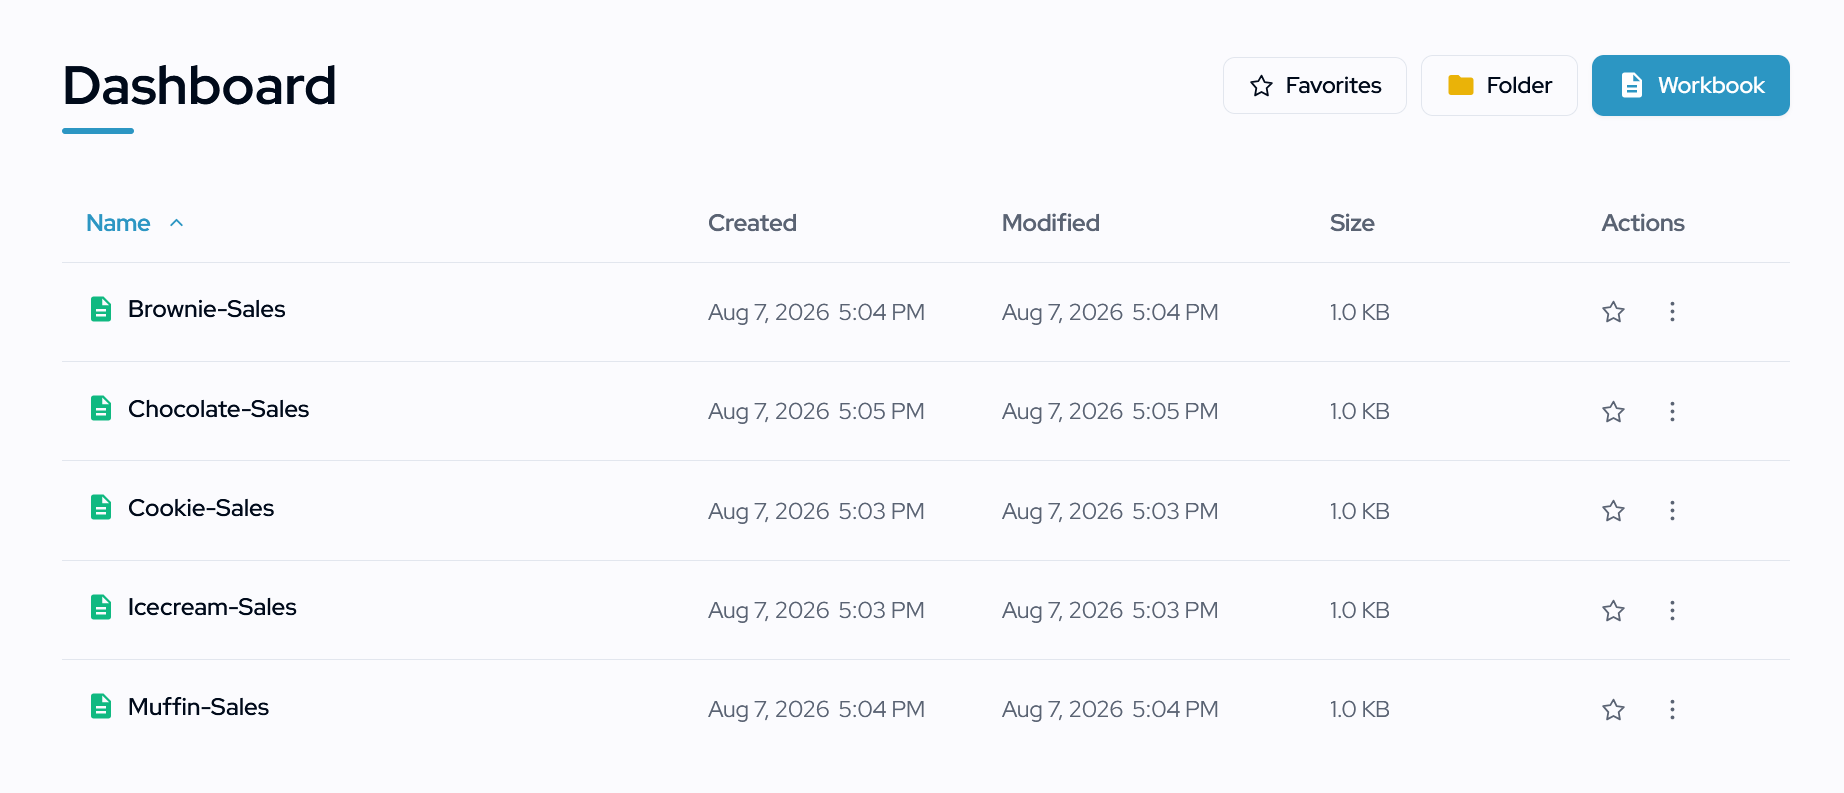
TelAIscope dashboard with forecasting workbooks and projects
01 · Connect the data

Start with the ERP data you already have.

Bring an export from the ERP system your team already uses into a forecast-ready workbook. The table stays familiar while the forecasting choices become explicit.

  • Use data from SAP, Odoo, Microsoft Dynamics, Shopify, or another ERP system
  • Use Excel or other tabular files when that is what the process already produces
  • Set the target series, frequency, and forecast horizon in one place
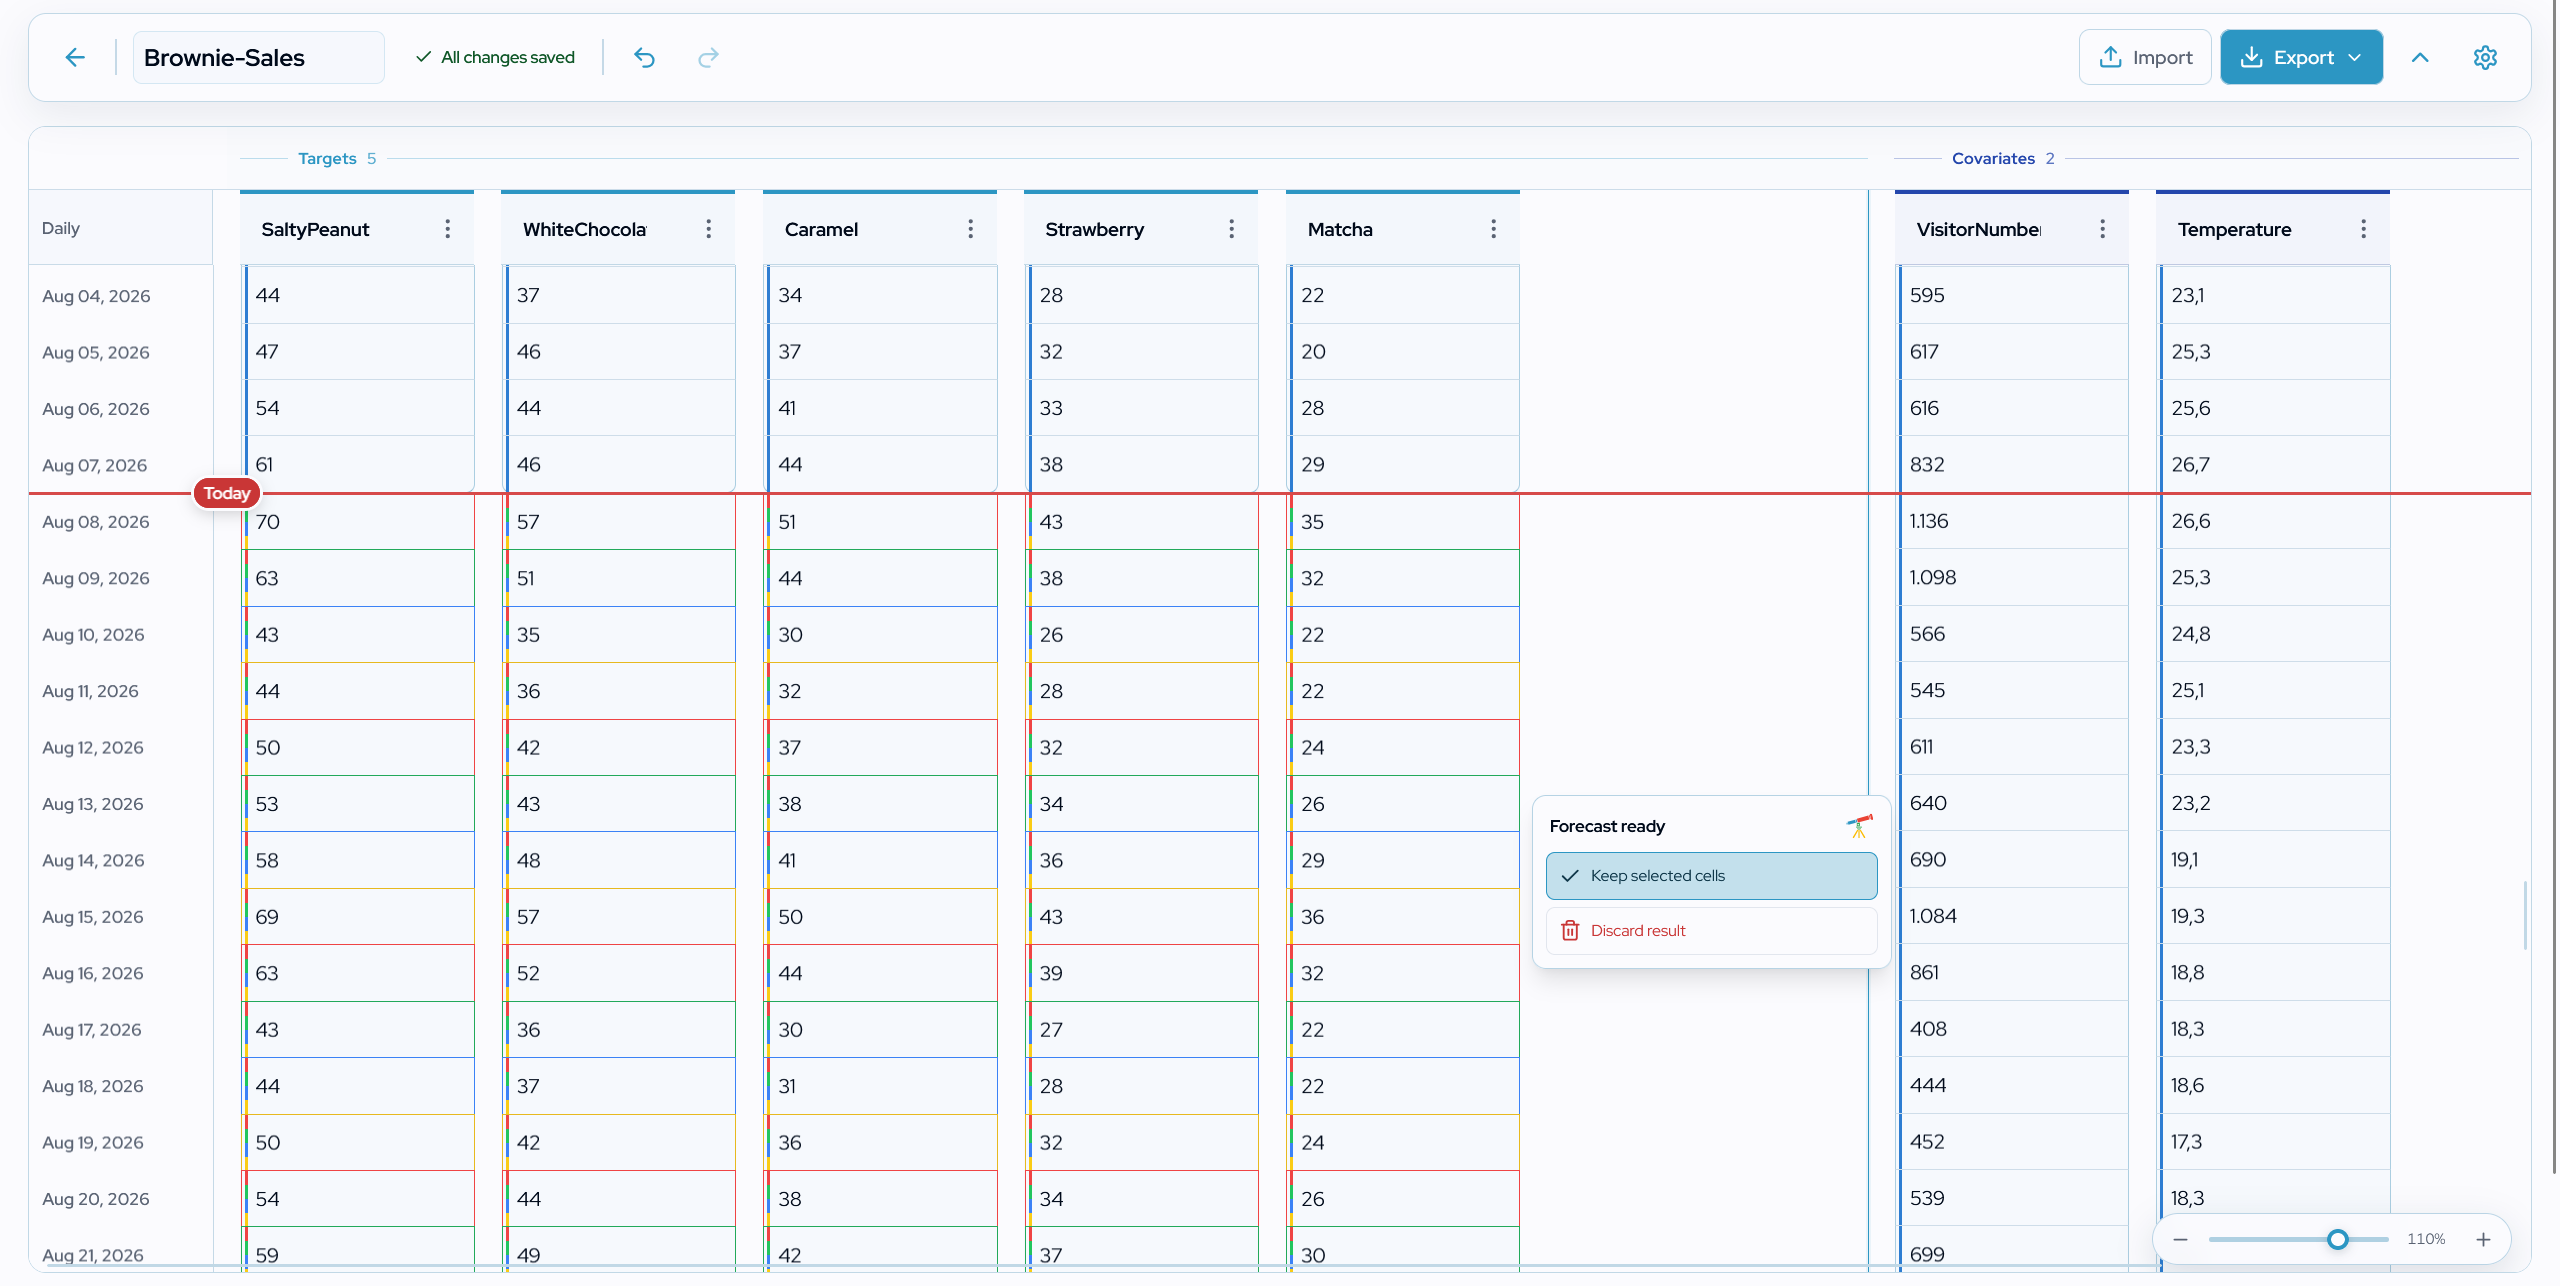
TelAIscope workbook with target series and covariate columns
A familiar grid with the forecasting decisions beside the data.
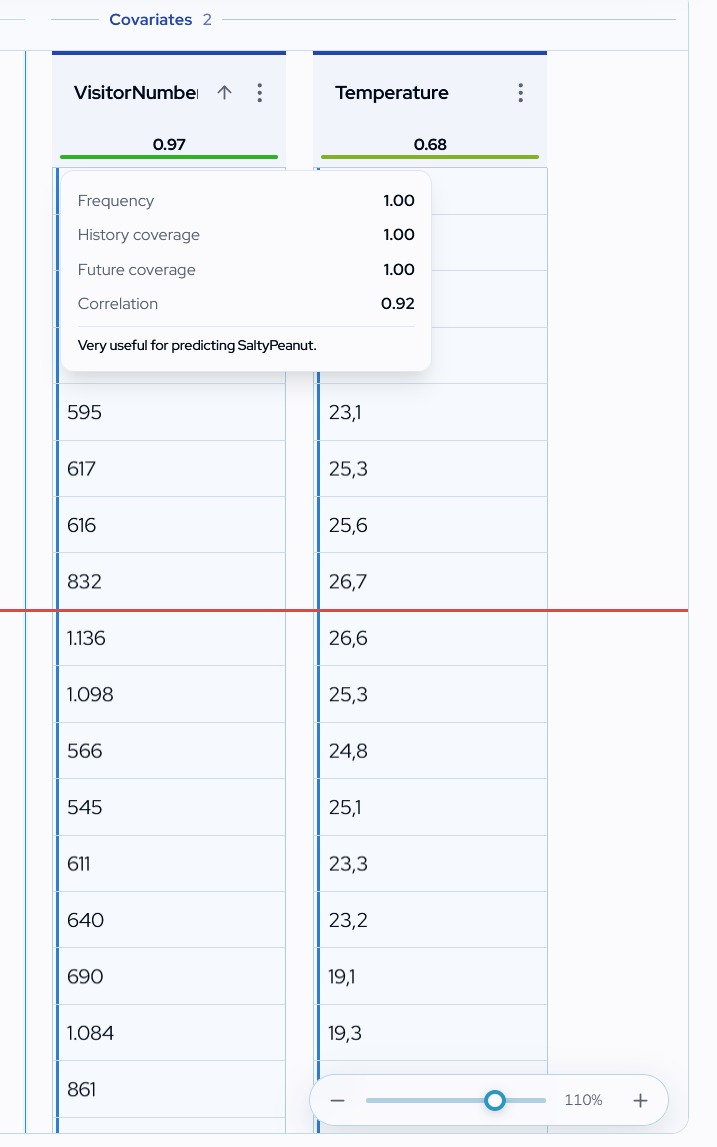
TelAIscope covariate utility result showing useful and noisy drivers
Covariate utility makes a driver easier to distinguish from noise.
02 · Add useful context

Add the factors that can change the forecast.

Promotion, price, weather, calendar, and operational signals can move a series. TelAIscope helps you see which factors add utility and which only add noise.

FactorUtility
Promotion0.91
Price0.76
Temperature0.63
Noise feature0.08
03 · Compare models with backtests

Choose the model that proves itself on your history.

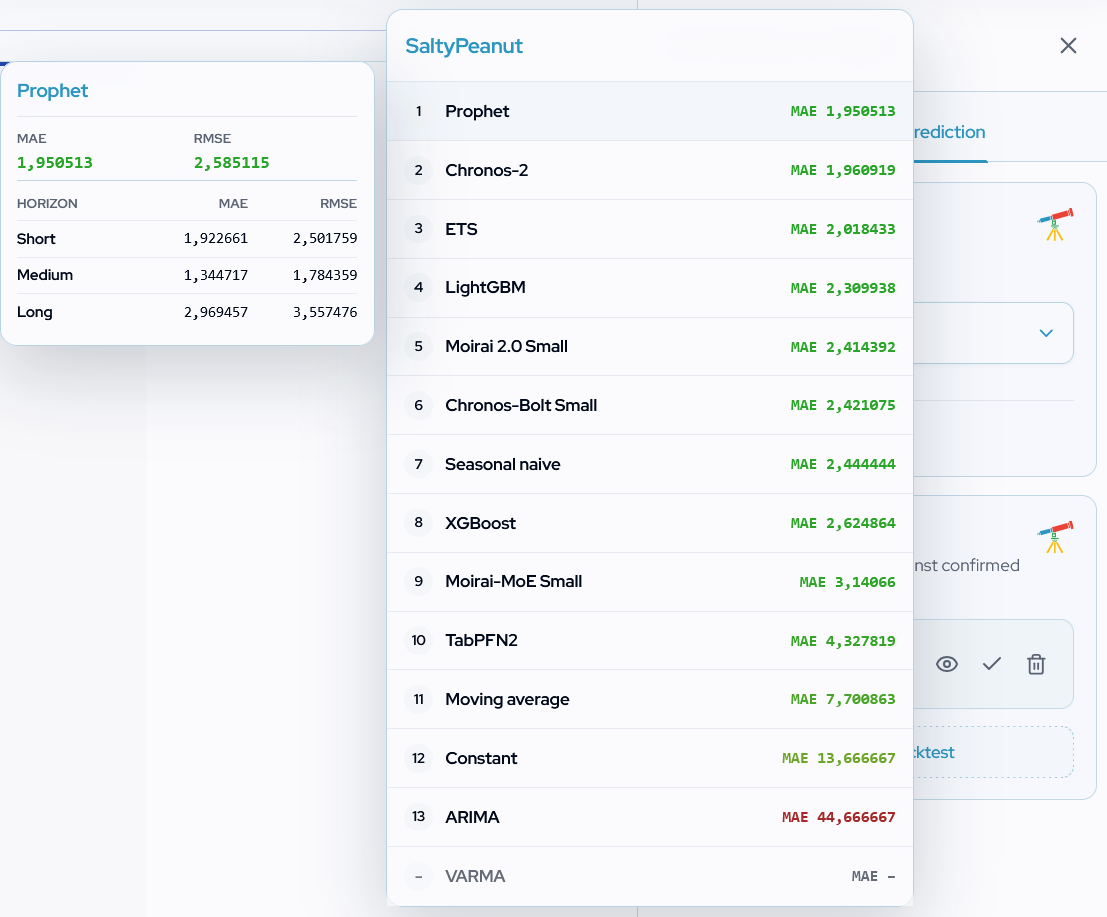
TelAIscope tests TSFMs, ML models, statistical models, and simple baselines on a held-out part of your history. You can see which approach actually works for the series in front of you.

  • TSFMs: learned temporal patterns as a strong starting point
  • ML models: known drivers and their relationships to the target
  • Statistical models: transparent comparison points
  • Baselines: simple references that put improvement in context
TelAIscope backtest result comparing forecasting models
Backtests show which approach performs best on history it did not see.
04 · Potential application scenarios

The target changes. The planning logic stays clear.

The same forecasting workflow can support a planner’s next decision and management’s wider operating goal.

Packages in a shopping cart on a laptop
01

E-commerce demand

Plan the next assortment before bestsellers disappear.

Target
Units sold by SKU
Covariates
Price · promotion · season
Impact
Fewer stockouts and markdowns
Warehouse shelves filled with inventory
02

Inventory planning

Turn expected movement into a replenishment signal.

Target
Stock movement
Covariates
Demand · lead time · safety stock
Impact
Less tied-up working capital
Solar panels across a field at sunset
03

Energy operations

Prepare capacity around changing generation patterns.

Target
Renewable output
Covariates
Weather · irradiance · history
Impact
Better capacity planning
Financial planning documents and charts on a desk
04

Financial planning

Make recurring revenue and budget assumptions easier to review.

Target
Revenue or cash flow
Covariates
Pipeline · calendar · rates
Impact
Clearer budget decisions
Healthcare analyst working with several monitors
05

Healthcare operations

Match staffing and resources to expected demand.

Target
Appointments or workload
Covariates
Calendar · staffing · demand
Impact
Fewer capacity bottlenecks
Lightning storm over a city at night
06

Weather-sensitive demand

Bring known conditions into the next planning cycle.

Target
Daily demand
Covariates
Temperature · rain · events
Impact
Less waste, steadier service
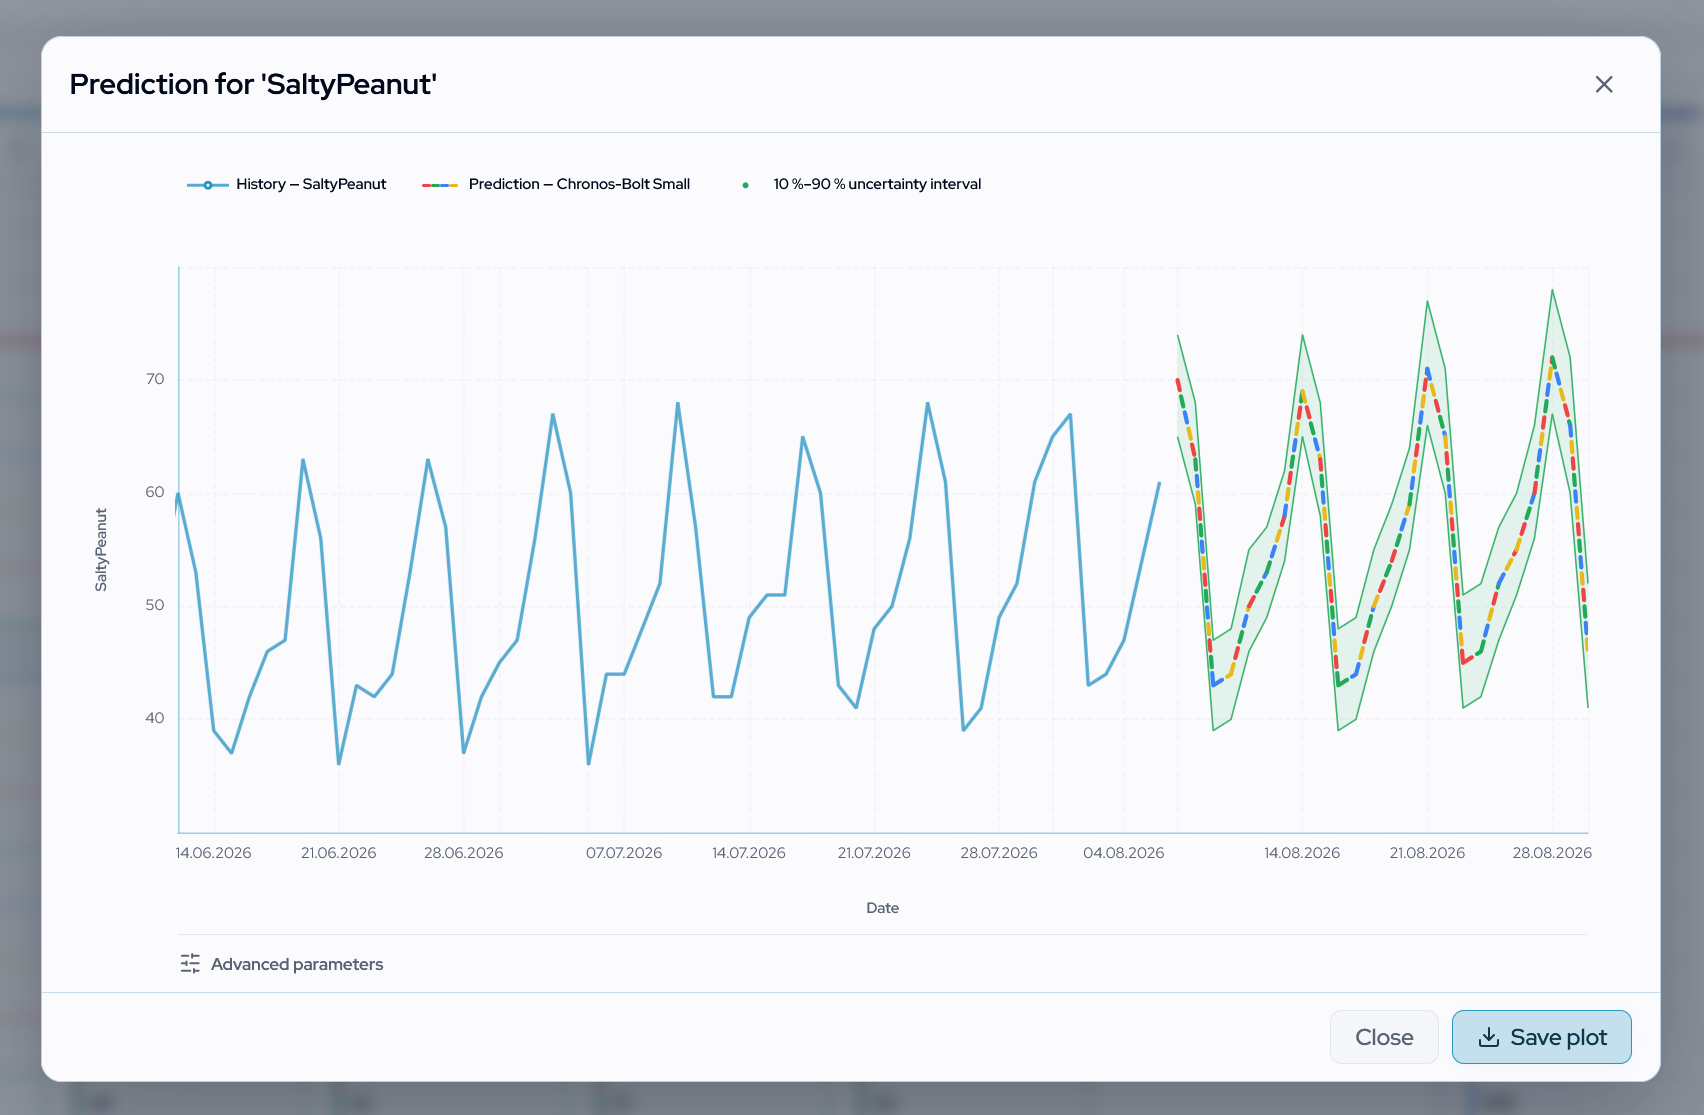
TelAIscope forecast plot with historical values, expected path, and prediction interval
A prediction interval makes uncertainty part of the planning conversation.
05 · Forecast and uncertainty

A forecast is more than a single value.

See the expected path together with its prediction interval, horizon, and model context.

  • Prediction interval: which outcomes are plausible?
  • Horizon: how far ahead does the view extend?
  • Comparison: which series or scenario needs attention?
06 · One week in the planning workflow

From data export to decision — in minutes, not hours.

The operational planner starts the forecast, reviews only the relevant exceptions, and shares a result the team can use immediately.

Example weekly workflowNext 12 weeks
Ready for planning
01Monday · 09:00

Refresh the data

Load the current ERP export and check target, frequency, and horizon.

02Monday · 09:10

Review exceptions

Focus on wide intervals, sharp changes, and series that need attention.

03Monday · 09:25

Set priorities

Adjust replenishment, capacity, or working capital where the evidence points.

04Monday · 09:35

Share the result

Export a PDF with an NLP explanation: why the model forecasted these values and how to improve the forecast further.

Make forecasting part of the planning rhythm.

Start with one series and see how a more focused workflow feels.

Book a demo