
Forecasting intelligence your team can inspect.
TelAIscope combines Time Series Foundation Models (TSFMs), ML models, statistical approaches, and baseline prediction methods. Your team can see why a model was chosen and how it performed on known data.
Match the method to the pattern.
- Time Series Foundation Models (TSFMs) as new, state-of-the-art forecasting models: transfer learned temporal patterns to new series
- ML models: connect known covariates to the target and learn non-linear relationships
- Statistical models: provide transparent references for trend, seasonality, and autocorrelation
- Baselines: simple prediction methods against which improvement can be measured
 A high-performance forecast
Use learned patterns without starting from zero.
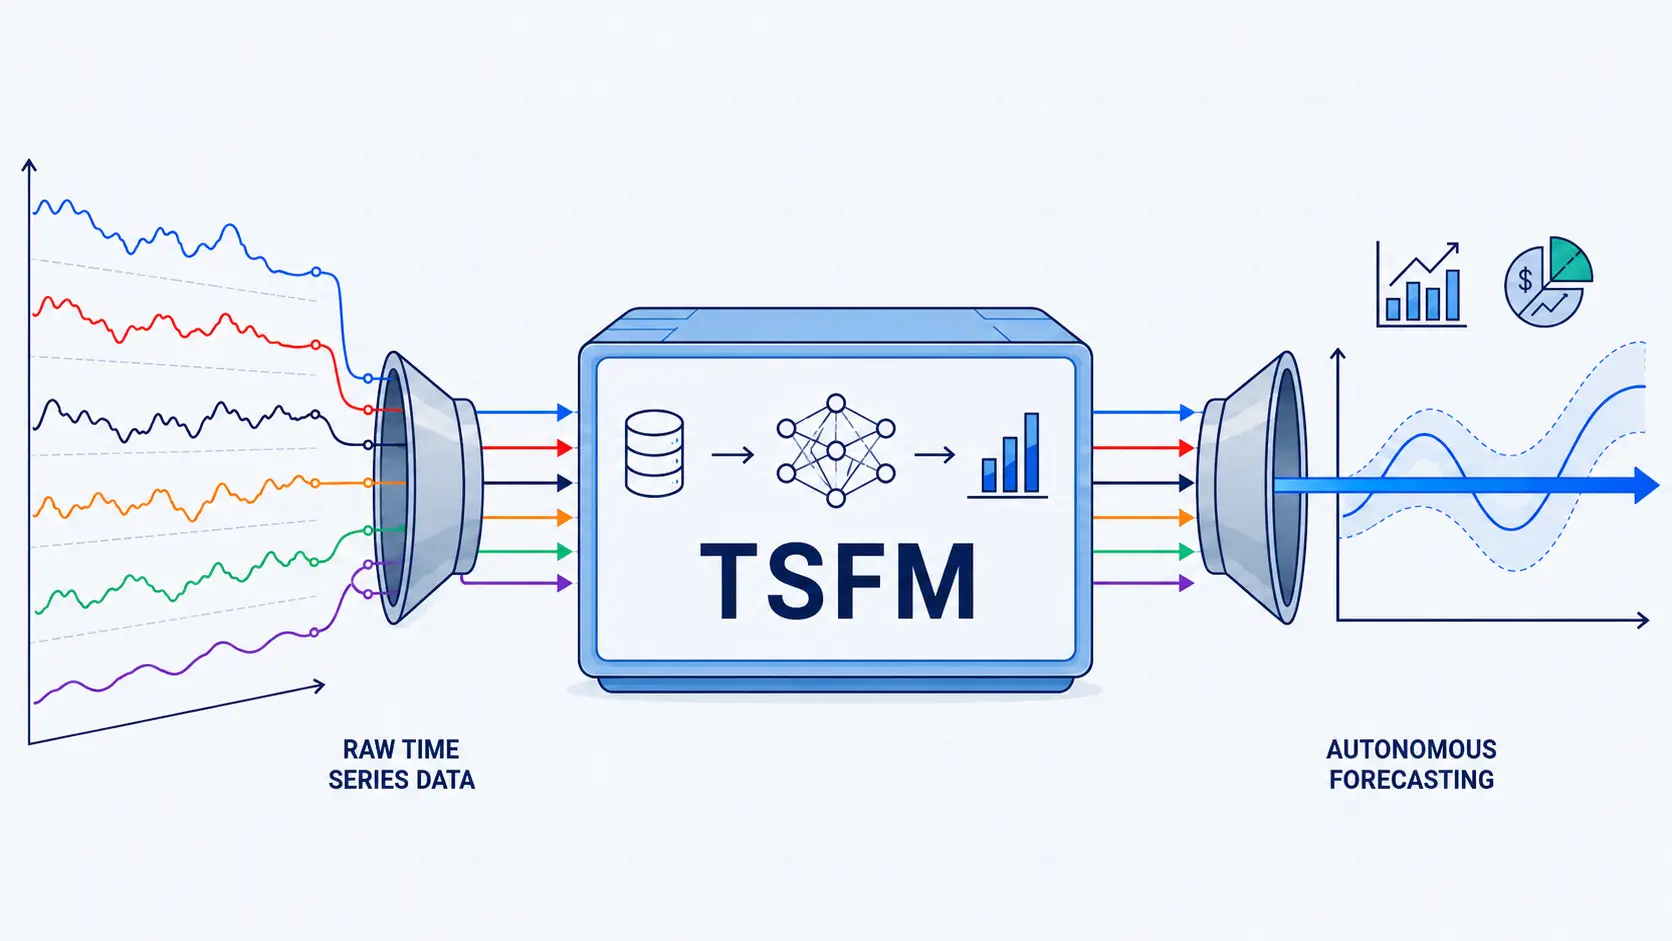
Time Series Foundation Models (TSFMs) work on a similar idea to Large Language Models: both use transformer architectures to learn the most likely continuation of a context — TSFMs work with time series instead of language. TelAIscope offers five specialized TSFMs, from TelAIscope Nano to TelAIscope Max. They transfer learned patterns to new forecasting tasks, as shown in the graphic.
- Transfer patterns learned across domains to new series and forecasting tasks
- Connect the learned prior with the customer’s own target history
- Keep the result reviewable through model comparison and planning context
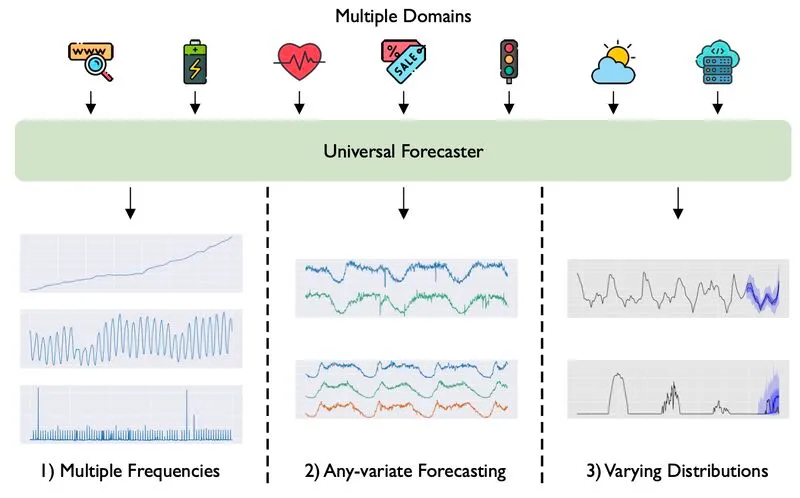
Forecast the drivers, not only the history.
External and operational signals can explain why a series changes. Use them when they are available for the forecast horizon, plausibly related to the target, and useful for the decision.
- Only use future drivers that are known or can be forecast
- Prefer signals with a clear operational relationship to the target
- Check covariate utility before adding more variables
Automate data, forecasting, and delivery.
Synchronize ERP data and covariates automatically each day, run the forecast on a fixed weekly schedule, and send the result directly to the user by email. The planner only checks unusual values; data preparation, model execution, and delivery happen automatically.
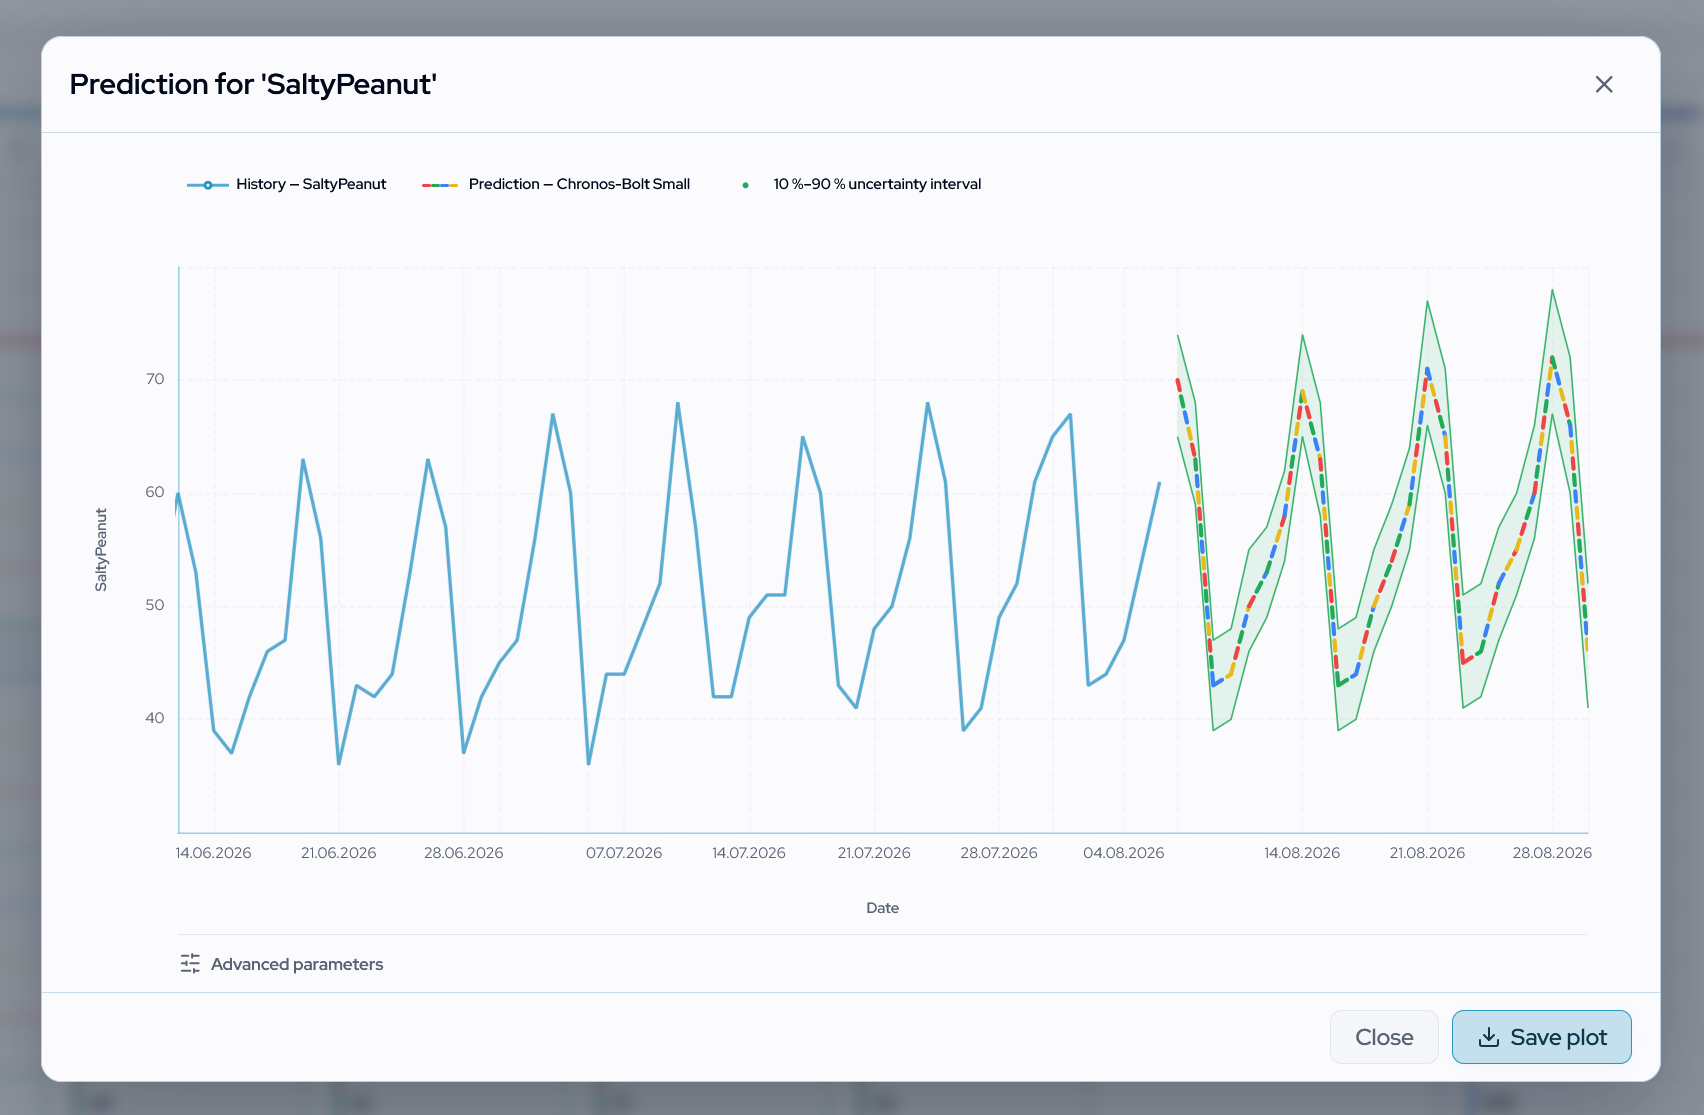
Plan with a range, not false certainty.
A prediction interval makes room for plausible outcomes. A clear plot keeps the expected path, uncertainty, and model context together for the person making the decision.
- See a prediction interval instead of one isolated estimate
- Review expected path and range in one readable plot
- Use the range to discuss buffers, capacity, or service risk

Data protection and governance belong in the workflow.
TelAIscope builds forecasting around European expectations: data is protected, model decisions remain reviewable, and responsibility stays with the operating team.
Bring evidence into the planning conversation.
Start with one series and see how a structured forecasting workflow feels.